At a glance
- Business
- High-volume UK retailer selling a large regulated catalogue through eBay and owned channels
- Problem
- Strong gross sales masked weak and negative SKU economics across disconnected order, fee and stock systems
- Analysis window
- 60 days
- Scope
- Roughly 7,750 orders, 20,000 order lines and 9,300 finance transactions
- Finding
- About £1,100 estimated margin in the model and more than 700 loss-making SKUs
- Observed signal
- Estimated margin rate roughly doubled; estimated daily losses in the flagged removal cohort fell by about 48%
The sales number looked healthy
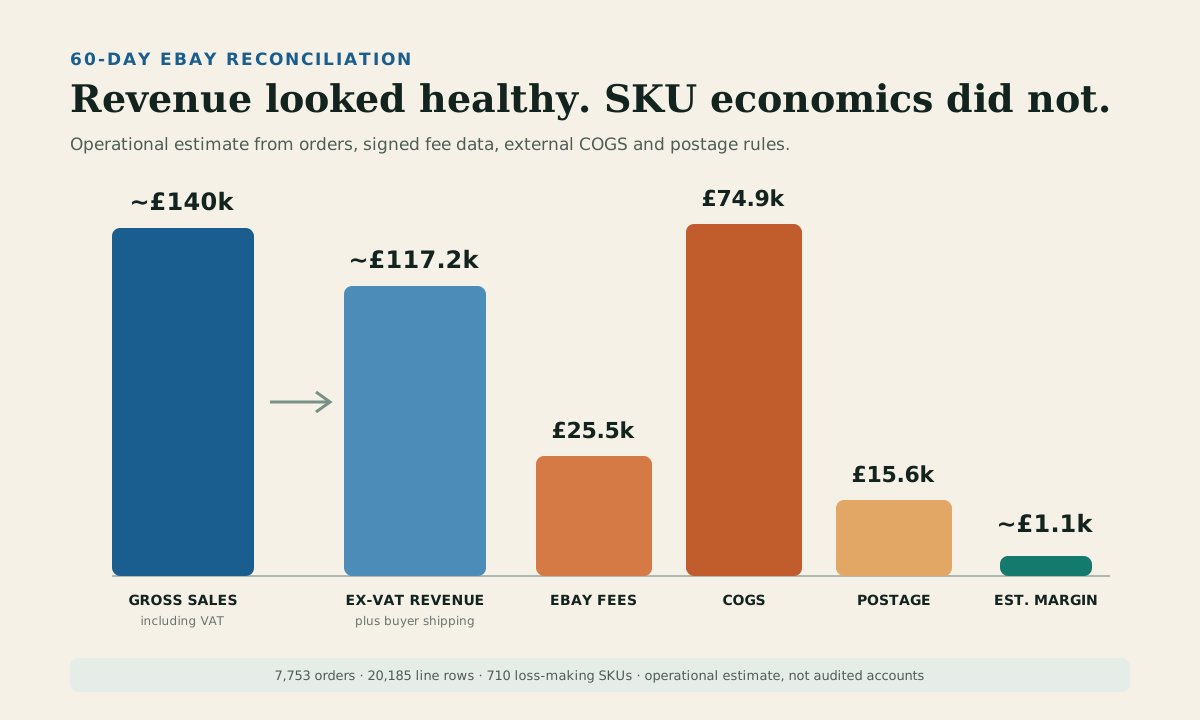
The eBay channel generated about £140,000 in gross sales including VAT during the 60-day period.
At that level, it was easy to assume the problem was optimisation rather than profitability. The store had volume, active listings and regular payouts. What it did not have was one report that could connect each order line to all the costs required to judge it properly.
eBay was not the only source of truth. Order and fee data lived in eBay. Product costs lived in the retailer's stock system. Some marketplace SKUs represented packs that needed to be traced back to a base product. Postage was not always represented in the same place or at the same grain. VAT, refunds, buyer-paid shipping and fee direction all affected the calculation.
The platform could show what sold and what was paid out. The operator needed to know what actually made money.
Why native reporting was not enough for this operation
eBay provides an Earnings report with gross sales, expenses, refunds, optional item costs and net earnings. Its Finances API also exposes fees and transaction summaries. Those tools are useful; the problem was reconciling them with the retailer's external data at catalogue scale.
The limitation was specific to the retailer's operating model:
- Cost of goods was maintained in an external stock system.
- Some postage costs needed a documented fallback.
- Packs and bundles did not always map one marketplace SKU to one stock item.
- Different systems used different names and reporting grains.
- The operator needed catalogue-wide SKU actions, not only a payout summary.
Without reconciling those sources, a profitable range, a break-even product and a loss-making SKU could all contribute to the same top-line sales number.
How we calculated eBay profit across a large catalogue
We built a repeatable pipeline around four data and rule layers.
1. Fulfilment orders
The eBay Fulfillment API supplied the orders, line items, quantities, SKUs, sale values, tax details and buyer-paid shipping used in the analysis.
The 60-day export contained roughly 7,750 orders and 20,000 line rows. Keeping the line-level grain mattered because profitability decisions were made by SKU, not by order total.
2. Signed finance transactions
The eBay Finances API supplied transaction and fee data. Fees had to be attributed with the correct sign and linked back to the relevant order or line.
The export contained more than 9,300 finance transactions and attributed about £25,500 in eBay fees during the window.
3. External product costs
COGS came from the retailer's stock-cost source plus a controlled override file. Pack SKUs could infer a cost from a base SKU when the naming relationship was reliable.
The final run matched about £74,900 in COGS and left no actionable SKU without a cost. That did not mean eBay contained every cost. It meant the reconciliation had resolved the missing mappings using the external source, pack rules and manual overrides.
4. VAT and postage rules
VAT used eBay tax lines where available and otherwise estimated standard UK VAT as one-sixth of the VAT-inclusive sale value.
Actual postage used finance data where it was exposed. Otherwise, the model applied a documented per-order fallback and allocated it across the order lines. The resulting postage estimate was about £15,600.
What the analysis found
The model reduced about £140,000 of gross sales including VAT to roughly £117,200 of ex-VAT revenue plus buyer shipping.
After the attributed eBay fees, COGS, postage and other line-level adjustments, the estimated margin was about £1,100. That was an operational estimate before wider business overhead. The operating team's assessment was that the channel was loss-making in practice.
The aggregate result was only the start. The SKU-level report found:
- More than 700 loss-making SKUs.
- More than 1,000 SKUs below 5% margin.
- No actionable missing COGS left unresolved.
- Loss-making products with meaningful sales volume, not only dormant catalogue noise.
Some of the worst lines were losing roughly 15-30% under the model. Others produced high turnover while losing a smaller amount on every unit. Both cases mattered: a high-volume small loss can be more damaging than an obviously broken low-volume listing.
Turning a diagnosis into decisions
The first response was not a blanket price increase. A broad rise would have damaged strong listings and reduced conversion on products that were already commercially acceptable.
The action model separated the catalogue into different decisions:
- Protect healthy prices and monitor or promote strong lines.
- Make small or modest increases where an 8% target was plausible.
- Fold structurally loss-making ranges rather than chase unrealistic prices.
- Remove individual loss-making SKUs where the wider range remained useful.
- Hold ambiguous or highly sensitive lines for manual review.
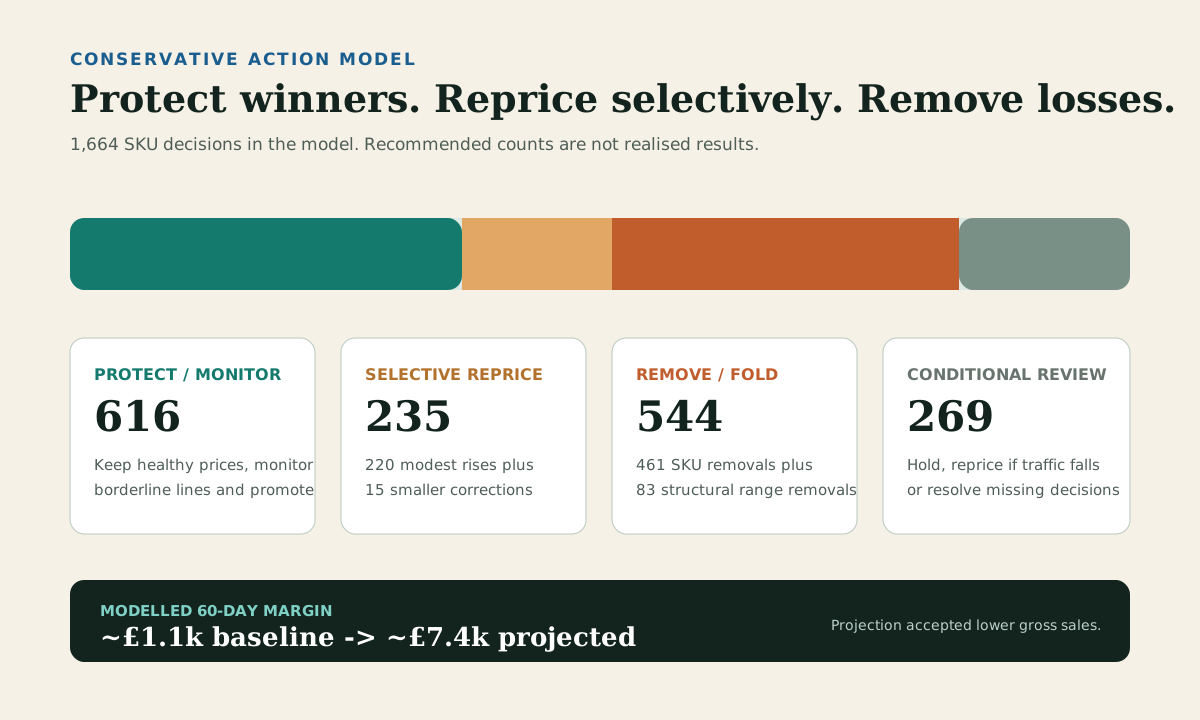
The model covered 1,664 SKU decisions. It recommended 235 selective price corrections, 544 SKU or range removals, 616 keep, monitor or promote decisions, and 269 conditional or manual reviews.
Its conservative scenario projected 60-day margin increasing from about £1,100 to about £7,400 while gross sales fell from about £140,000 to about £95,000. That trade-off was intentional. Revenue that destroys margin is not automatically worth protecting.
What changed in the business
The operating team confirms that the analysis led to real commercial action. Prices were raised selectively rather than indiscriminately. Lines that were not worth carrying were folded. Existing ranges and listings were improved. New lines were added with stronger margin screening, so the same visibility problem did not simply return as the catalogue grew.
We reran the reconciliation from live eBay order and finance data after the first round of changes. The fresh catalogue included new SKUs without matched COGS, so using the raw total margin would have overstated the result. Instead, we compared the same products with known costs in both periods.
For that comparable cohort, the estimated margin rate roughly doubled and estimated margin per day increased by about 124%. Sales volume was maintained rather than sacrificed to achieve the improvement.
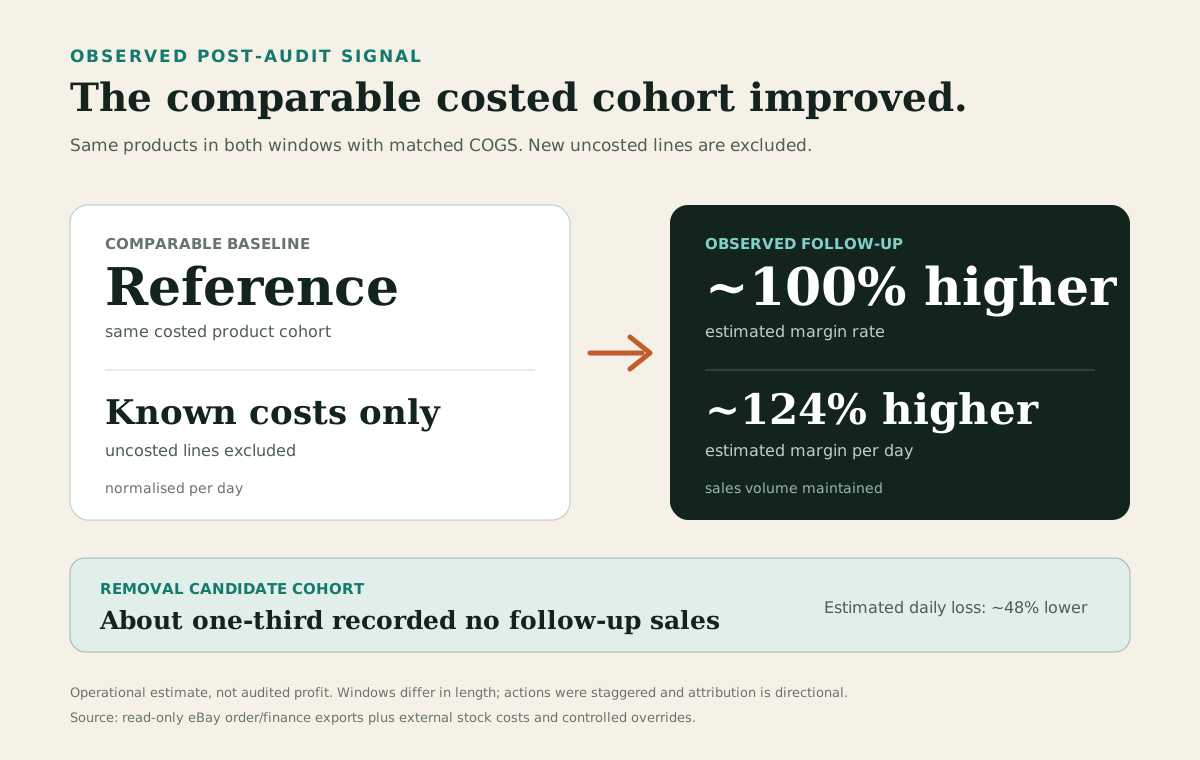
The removal cohort provided a second signal. Estimated daily losses across products flagged to pause or fold fell by about 48%, and roughly one-third recorded no sales in the follow-up window.
That is meaningful progress, but it is not a completed fix. The analysis had already identified the lines requiring action; implementation by the operating team remained partial, and too many uneconomic lines continued trading. The remaining loss pool is now primarily an execution backlog rather than a visibility problem.
The fresh evidence supports the direction of change. It does not show that every recommendation was implemented, isolate the effect of repricing from product mix or seasonality, or prove that the channel achieved the modelled £7,400 margin.
That distinction matters. The analysis succeeded because it changed decisions and created a method that could test those decisions again without confusing a projection with an outcome.
What marketplace operators should check
The problem is not unique to eBay. Any marketplace analysis can become misleading when the sale, fee, fulfilment and cost systems are separate.
- Are sales measured including or excluding VAT?
- Are marketplace fees attributed at the correct order or line level?
- Are postage and fulfilment costs complete, including labels bought elsewhere?
- Does every marketplace SKU map to a real unit cost?
- How are packs, bundles and multipacks handled?
- Are refunds, discounts and buyer-paid shipping consistently treated?
- Which products are loss-making, and which are only below target?
- Should the action be reprice, remove, improve, monitor or promote?
- Can the same analysis be rerun after changes?
The last question turns an investigation into an operating system.
Why this became more than a report
The value was not the discovery that fees and costs exist. The value was creating one traceable view across systems that had never been designed to answer the same question.
The analysis made the assumptions visible. It separated current evidence from projections. It produced an action file at SKU level. It also created a repeatable method for screening new ranges and measuring the effect of future changes.
Gross sales remained useful. They just stopped being mistaken for profit.
eBay profit analysis: common questions
How do you calculate profit on eBay?
For this operational analysis, contribution was calculated from ex-VAT sales and buyer-paid shipping, less eBay fees, COGS and postage. The exact model should also state how it treats refunds, discounts, promoted-listing costs and wider overhead rather than hiding them inside a single payout figure.
Why is an eBay payout not the same as profit?
A payout reflects marketplace transactions. It may not contain the retailer's external stock costs, postage bought elsewhere, bundle logic or business overhead. Those sources must be reconciled before the channel can be judged commercially.
What belongs in an eBay SKU-profit report?
At minimum: quantity, VAT treatment, selling price, buyer shipping, marketplace fees, unit COGS, postage, refunds or discounts where applicable, contribution margin and a flag for missing or inferred costs.
How often should marketplace margin be recalculated?
Rerun it after material changes to fees, stock costs, postage, prices or range composition. A recurring monthly view is more useful than a one-off audit because it shows whether agreed actions were actually implemented.
Method note
This case uses live eBay Fulfillment and signed Finances API exports, with COGS from the retailer's stock data and controlled overrides. Postage uses finance data where present and a documented per-order fallback otherwise. VAT uses eBay tax data where available and a standard UK estimate otherwise. The after-state uses only products with matched COGS in both windows; new uncosted lines are excluded. Figures are operational estimates over unequal periods, not audited accounts. The business, store, buyers, products and SKUs are anonymised.
NEXT STEP / HOLLOW POINT
Find out what the channel actually makes.
Hollowpoint connects marketplace activity, stock costs and commercial decisions, then builds the recurring operating view needed to act on them.